The “Portland Police have been defunded!” talking point is really absurd and needs to stop
The title of this piece gives away the game, I guess. But it’s a really silly game. The “defund” narrative has been used to attack or support various political candidates, characterize the residents of Portland in the national press, and generally obscure causes, effects, and the actual government of Portland and its relationship to the Portland Police Bureau (PPB). I’ve been accosted by angry men at bars regarding the issue.1 So let’s be really clear: there is no reasonable interpretation under which the statement “PPB has been defunded” is true.
In the space below I present data that demonstrates this, examining PPB’s and the City of Portland’s budgets over time, and decomposing pieces of PPB’s budgets during various years. It turns out that:
- PPB’s budget tracks the City’s fairly closely;
- the “defunding” moment is largely indistinguishable from other budgetary fluctuations;
- and the amount spent on patrol alone between 2017 and 2022 increased at least ~53%.
“Defund the police” is a slogan that arose out of the ongoing police and prison abolition movement. You can learn more about these movements generally through Critical Resistance and locally through Care Not Cops, although there are many other sources and examples. The general thrust of abolitionism is against racial capitalism: That is to say, prisons and police—instruments of state violence—are not at all about safety or justice for all, but rather instruments of oppression which ensure comfort of a small minority and the continued functioning of capital accumulation. Opinion ranges regarding both contemporary strategies to ultimately produce abolition as well as what the actual goal itself should look like. As Ruth Wilson Gilmore puts it, abolition is a “plot,” in two senses: 1) a plan to end racial capitalism and 2) a narrative in which the “arc of change is always going resolutely toward freedom.” Abolition in an anarchistic mode dreams of a world free from all forms of oppression; abolition in a statist mode looks more like Alex Vitale’s suggestions in The End of Policing: “We can use the power of communities and government to make our cities safer without relying on police, courts, and prisons. We need to invest in individuals and communities…” (pp. 222-3) Most talking heads ignore these distinctions completely.
Under this larger umbrella, the budgetary incarnation of abolition—the slogan “defund the police”—hews much closer to a statist line than an anarchistic one. When I first heard it, I envisioned a zero line item for PPB and all of their budget dollars being reallocated to health, substance abuse treatment, fire, education, etc. The call, after all, was defund, not partially fund. Yet the most influential suggestion considered at the political table during the George Floyd/Breonna Taylor protests of 2020 was a set of demands by Portland’s African American Leadership Forum (PAALF, now known as Imagine Black) and Unite Oregon to reduce the proposed PPB budget by $50 million. For perspective, PPB’s adopted budget that year was more than $238 million—the “defund” demand was to reduce the police budget by less than a quarter.2 The plan, despite corresponding with the largest civil rights movement since the 1960s, was rejected largely out of hand. Portland Mayor Ted Wheeler (who is also the city commissioner responsible for PPB) complained of a pandemic-inspired $75 million budget shortfall. A perfect opportunity? Not so much: The Mercury reported that Wheeler’s plan, as it relates to PPB, was to freeze wages of non-unionized employees (note: cops are unionized) and cut the proposed body camera implementation and record management upgrades.
So what really happened? And what does it mean in historical context? I had difficulty finding answers. I’m no expert—my degrees are in social science, not accounting—but digging through publicly available documents here and checking my numbers through a finance expert who teaches accounting produced a set of interpretable numbers we can use to understand what actually happened. While I examine the budget closely below, budgets are documents constructed by politicians in dialogue with their constituents, at least in theory. So an additional question I want to wrestle with is tactical: what was the effect of engaging politely with the City of Portland and asking them to defund police, especially when compared to more militant street action? We’ll pick that up at the end.
Overall budgetary analysis
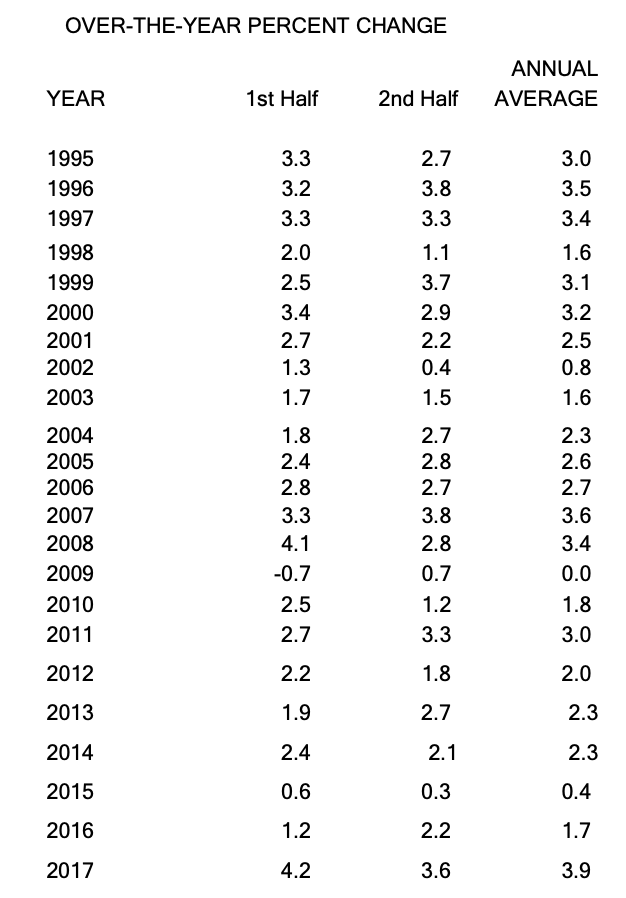
First things first: let’s remember that we’re all getting poorer as the consumer price index rises and cost of living adjustments fail to keep up. Unionized city employees—including cops—fell less further behind than those who were forced to take furloughs or had their wages frozen. (My union negotiated a 2-year 1% cost of living adjustment in 2021, for comparison.) Table 1 shows the Bureau of Labor Statistics’ Consumer Price Index (CPI) over time for Portland’s metro area from 2007 to 2017, the last available year I could find. Rather than adjust for inflation, which is a tricky proposition, I urge you all to simply bear this in mind—it’s not a constant, as the housing crisis of 2007-09 demonstrates, but it does rise fairly steadily, notwithstanding the quickening pace of economic crises. That said, 1) all things being equal, we should see an increase in budgetary allocation over time and 2) inflation hasn’t climbed more than ~4.7% since 2007 (average increase = 2.15%).
Budgets are plans for spending in the next fiscal year, which begins in June in the City of Portland. As a colleague of mine reminds me consistently, budgets are moral documents, directing and affirming attention and investment. Figure 2 represents several slightly different representations of the entire budget of the City of Portland. Adopted budgets are the final plan passed by the City for the next year. Those numbers are adjusted later for what actually happened during that year—the first year post-adoption provides the “revised” budget numbers while the “actual” budget expenditures don’t emerge until things have more completely settled, two years after adoption.3 Despite some small differences, between 2005 and 2022 the three trendlines tell a pretty similar story—a slightly bumpy gentle upward ride until about 2014 (City adopted budgets averaged about $3.3 billion over those years) when the budget began increasing more dramatically. The 2019-20 budget, adopted before COVID-19 began its continuing ravage, topped out at $5.6 billion. (Notice that revised and actual figures, on average, tend to outpace the adopted budgets.)
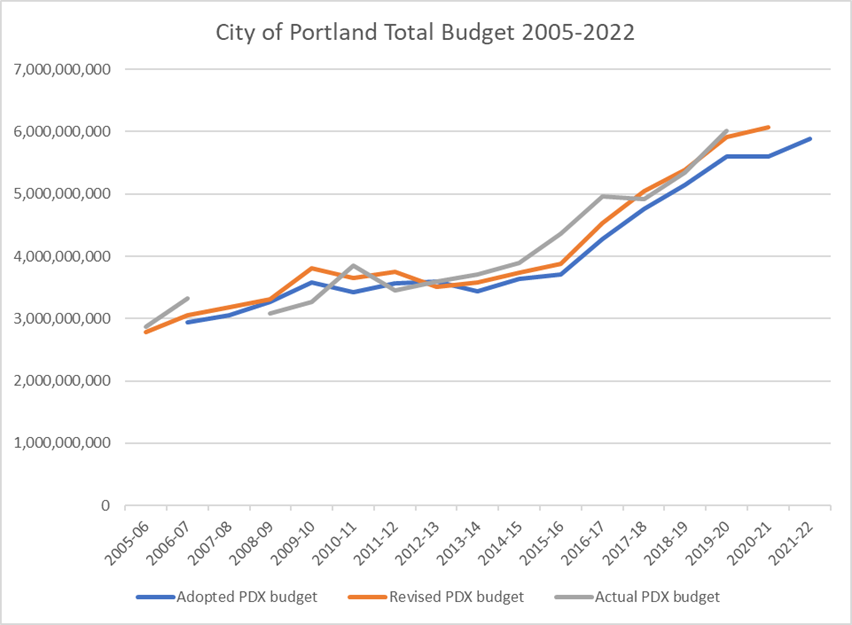
Despite endless media discussion of budget cuts (recall Wheeler’s -$75 million above), the first Portland budget during COVID actually flatlined. The Portland City Council ultimately adopted a budget above the 2019-20 figures, albeit just slightly (+$1.7 million).4 Indeed, the adopted budget for the fiscal year in which we currently reside (2021-22) increased by more than $285 million, over the slight increase of the year before. Wheeler’s dire predictions were not borne out, but the City budget during 2020-21 (0.03% increase from prior year) was a departure from the 15.6%, 11.3%, 8.0%, and 8.8% increases of previous years (2016-17 through 2019-20 respectively).
This is our budgetary context: after four years averaging significant budgetary growth, Portland in 2020-21 functioned essentially at the funding level of the prior year; hampered but neither destitute nor decreasing, and not obviously affecting service levels. Now what happened to police?
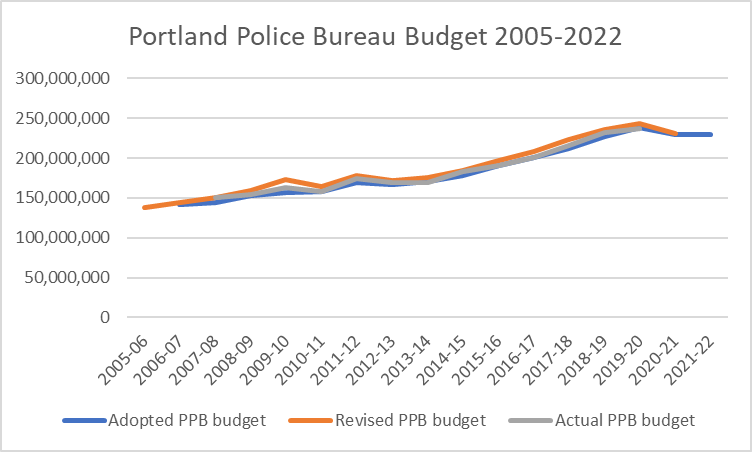
The shape of the PPB budget (Figure 3) greatly resembles that of the general Portland municipal budget. Investment in PPB is largely static. The two entities don’t move precisely in lockstep; the City budget tends to move in fits and starts while police budgeting is smoother. Figure 4 plots these raw numbers together, while Figure 5 plots the percent change from the prior fiscal year each budget experiences. The fiscal year that contains both the beginning of the Floyd/Taylor protest movement and COVID, 2020-21, does show about $8.7 million trimmed from the previous PPB budget. Zooming out makes this figure seem rather paltry: As Figure 5 shows, this is a very slight decline of about 3.6%. Moreover, the prior year (2019-20) yielded a budget increase of $11.3 million; budgets further back show increases of $15.5 million (2018-19), $10.1 million (2017-18), $11 million (2016-17), and $12.7 million (2015-16). An $8.7 million cut doesn’t even fully reverse the budgetary increase of the previous year, or any year, in recent history.
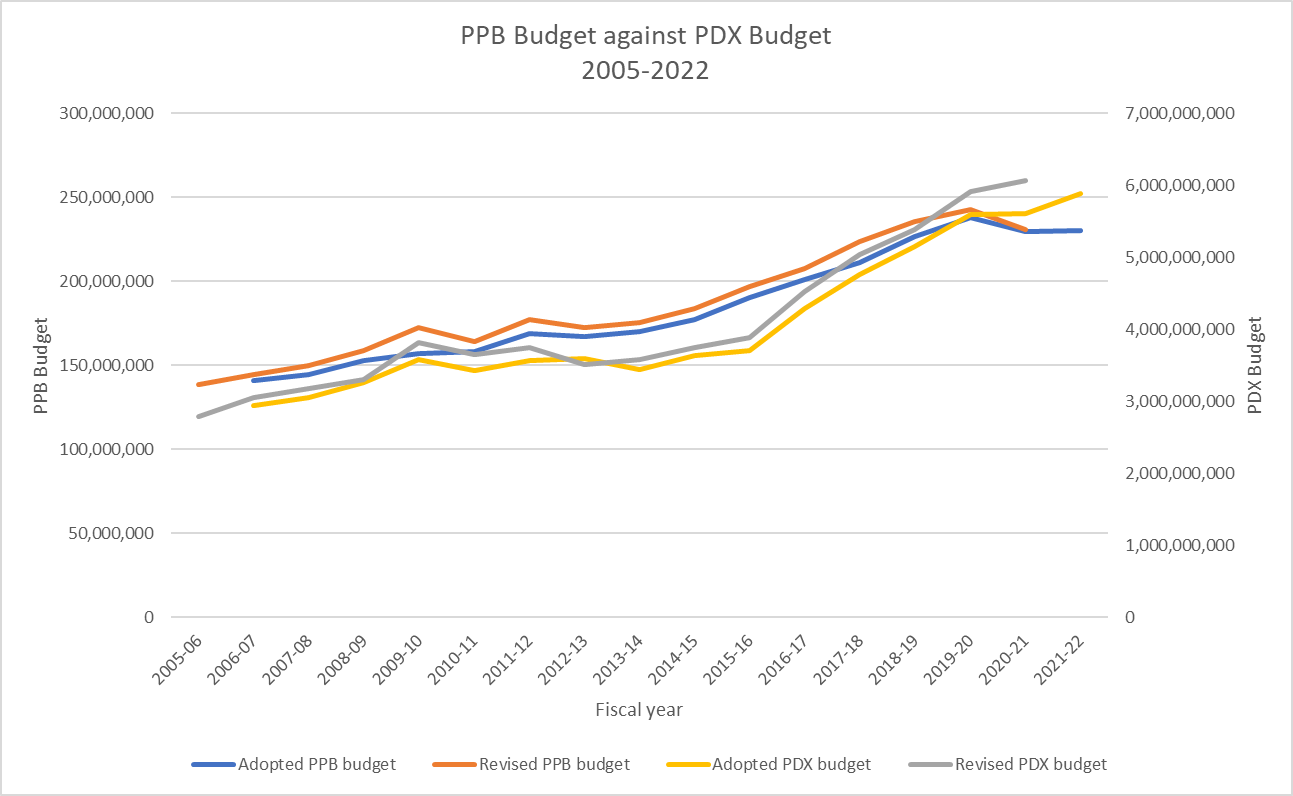
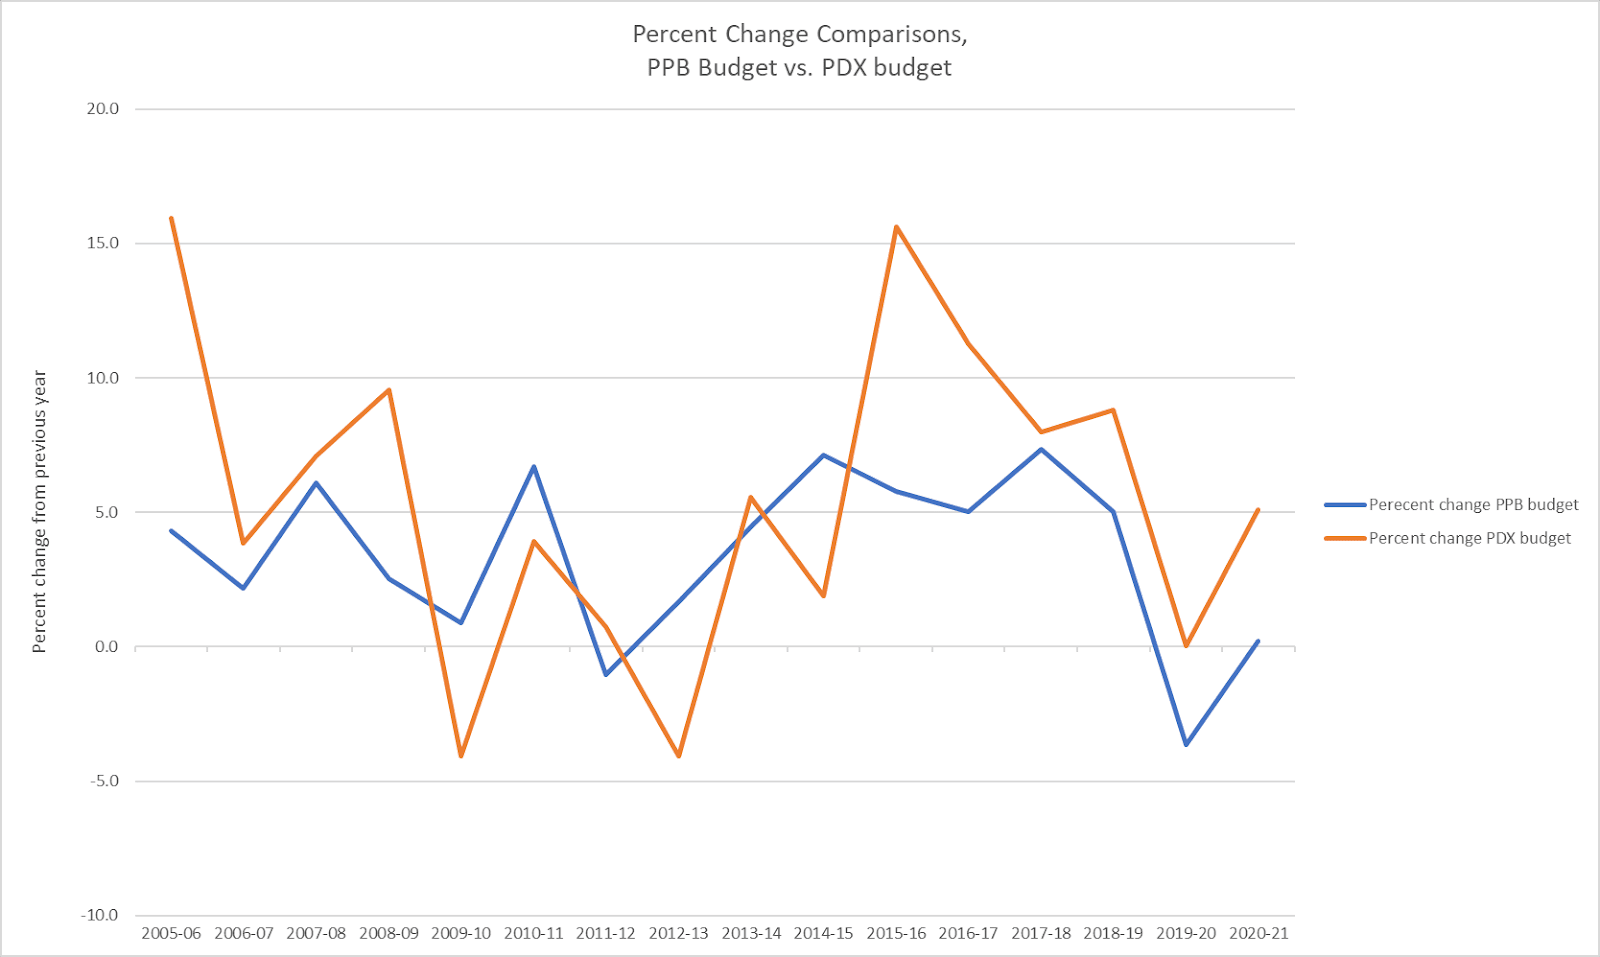
Historical context presents larger questions: What assumptions about the police budget does the “defund” narrative—and its reactions—highlight? Consider Figure 5 closely. PPB received a 5% increase in 2019-20; in 2020-21, they received a 3.6% decrease. The City’s budget was also affected (from +8.8% to flatline) and the visuals demonstrate how closely one tracks the other. There was also a small percent decrease in PPB’s budget in fiscal year 2012-13. Was that also a “defund” moment? Moreover, do we expect perpetual increases to the point that any fluctuation ought to be declared a “defunding”? Under such logic, it seems reasonable to ask why the City didn’t increase PPB’s budget more in 2016-17, a banner City budget year, with a 15% budgetary increase from the prior year. Yet the City Council only gave police a paltry 5% increase? Perhaps this is the defunding that ought to be highlighted. Someone else got PPB’s increase!
Naturally, these numbers are relative. So, what percentage does PPB represent of the City’s expenditures on all Bureaus (services like Fire, Public Works, Housing) or even the smaller Public Safety budget? PAALF and Unite Oregon’s original defund plan explained that PPB’s budget share was larger than many major cities including Atlanta, Baltimore, Detroit, Los Angeles, and New York City.
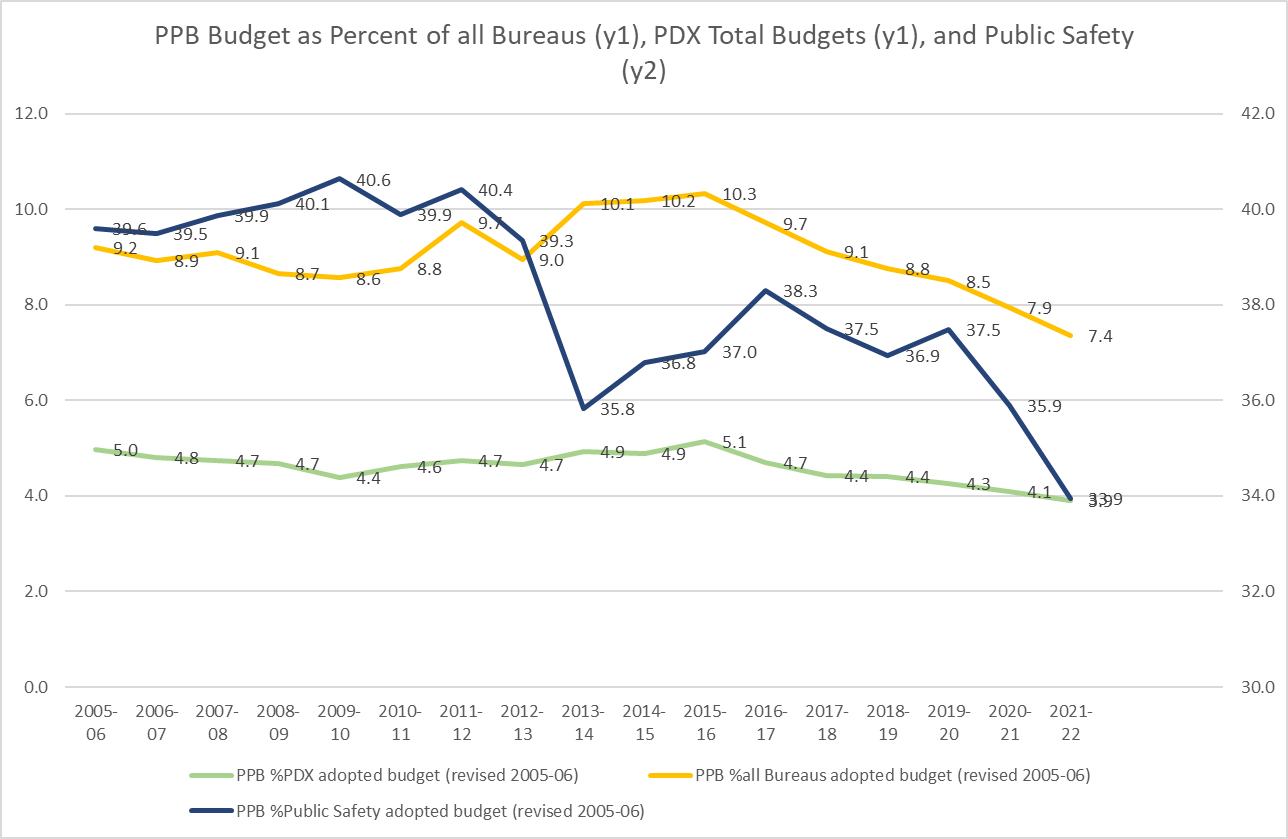
Figure 6 is a little confusing, but shows us these changes over time.5 The graph demonstrates the shape of the changes, so rather than plot them all on a single axis, I overlaid them (y2 is Public Safety). I don’t know precisely why these numbers move as they do—true budget nerds may know better—but the patterns are telling. As a percentage of the total City budget (green line) PPB was at its height in 2005-06 (5%) and 2015-16 (5.1%). The increases and decreases are gentle and follow multi-year trends, not abrupt shifts. Fiscal year 2021-22 (a year after “defunding”) is indeed the lowest percentage, yet this comes not as a dramatic single moment, but after very small decreases over 6 years. As a percentage of the Bureau’s budgets, we see a similar story—peaks at 2012-13 (9.7%) and 2015-16 (10.3%), followed by a gentle decline to a nadir in 2021-22 (7.4%). Anyone looking only at this graph and trying to guess in which year the police were defunded would likely be wrong, and not just on their first guess.
PPB staffing
Considering police as a piece of Public Safety (Figure 6 still) provides an interesting segue. The period between 2011 and 2014 provides a theatrical 4.6% reduction, as PPB moves from about 40+% of the Public Safety budget down to 35.8%—honestly, there’s your “defund” year. This is more compelling, to my eye, than the 2019-20 to 2020-21 decline which is 37.5% to 35.9% (for a grand total of -1.6%). More interesting though is that this recent decline continues through the present fiscal year (2021-22) for a historic trough of 33.9%—just over one-third of the Public Safety budget, down from a high of nearly 41%.6 What’s going on?
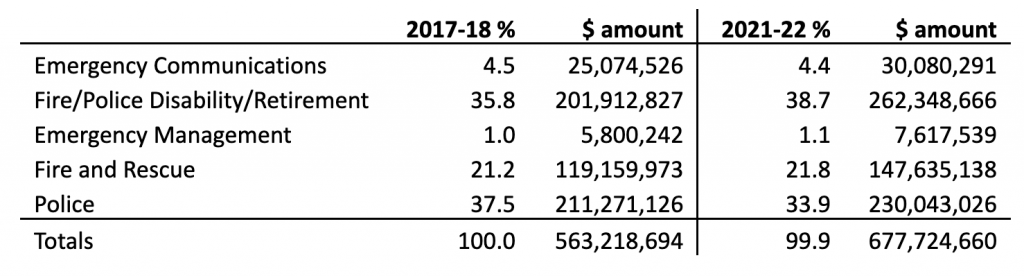
Since these numbers are a function of the larger Public Safety budget, let’s see what else is there. Table 1 breaks this down for 2021-22 and compares it to 2017-18—a recent fiscal year pre-pandemic and pre-uprising. There are five main pieces to Portland’s Public Safety budget. Between our comparison years, Emergency Communications barely budges (-0.1%); it’s the same story with Fire and Rescue (+0.6%) and Emergency Management (+0.1%). This is clearly not enough to account for the 3.6% decrease in PPB percentage. The real action is in the Fire/Police Disability/Retirement section (+2.9%). These numbers relate directly to things that are largely out of control of the budget office—when firefighters and cops are injured, retire, or quit, these numbers rise and this spending kicks in. And, of course, between 2017 and 2022, spending on police increased by nearly $19 million.7
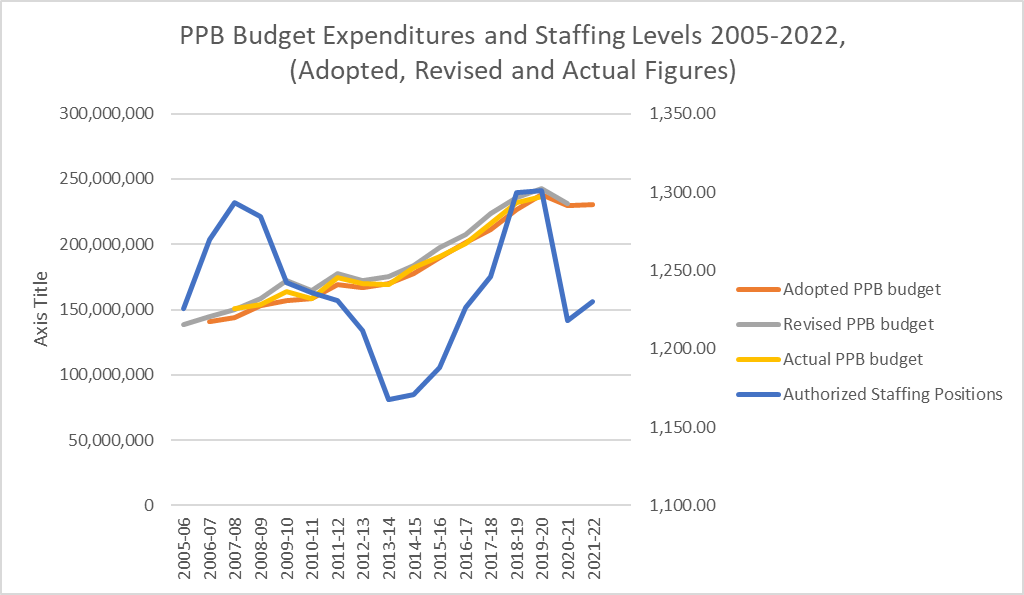
The big shift, then—and that’s a relative term for 3.6%—is not due to defunding PPB, but rather the growth of disability and retirement spending for fire and police. The reason, I suspect, that this is reflected primarily in the PPB budget is that quite a few officers have quit or retired. I’ve seen various numbers (100 officer shortfall, 34 quit at once, etc.), and media sources argue that much of this is due to street protests. These resignations likely swell the disability/retirement budget which is contractual and obligatory. Figure 7 demonstrates the authorized staffing positions over time plotted against PPB’s budget. Funding, as we’ve seen, steadily increases, but staffing swings wildly, and not just in 2019-2020. Between 2007-08 and 2013-14, ~126 staffed positions disappeared—2019-20 to 2020-21 lost ~84 staffed positions. We are not currently even at the nadir of PPB’s staffing however: the most recent budget saw a total of ~1,230 positions while compared to 2013-14’s ~1,168.8 As perhaps you’ve noticed now, the “defund” hyperbole is not only overblown but completely unremarkable in historical context.
Specific comparisons
Frankly, I ended with this section because much of the below analysis is speculative. For instance, I suspect that the official “Portland gang list” that was officially retired in 20179 remains both in circulation unofficially and has been replaced by a “gun violence list” (as is the case in NYC), but this is simply an educated guess born of long experience with police. Much of PPB’s structure has been reshuffled recently, however, budget notwithstanding, and we can analyze (to an extent) where money goes.
Two things are concrete. First, the School Resource Officer (SRO) program was eliminated in 2020-21. This doesn’t prevent PPB from “servicing” Portland Public Schools (PPS), but it does remove SROs as a permanent and integrated feature. Timelines and public information are muddled, but it seems as though the PPS Superintendent made this decision, not PPB, the City Council, or Wheeler. Regardless, we see $350,766 in the 2020-21 budget down from $1,614,454 in 2019-20 for SROs and $0 in 2021-22.10 Wheeler, Willamette Week reports, “redirected” this money to a “community-driven process”.11 I don’t know what that means, but I did find an additional $500k for “community engagement” in the 2021-22 adopted budget (so, one-third true?).
The other trumpeted change was the elimination of the Gun Violence Reduction Program—the old Gang Unit—which was eliminated over FY 2020-21 (~$3 million FY 2019-20; $650k FY 2020-21, $0 FY 2021-22). It seems, however, as though a lot of the functions of the former Gang Unit have been reincarnated as some combination of the Enhanced Community Safety Team (ECST), Focused Intervention Team (FIT), with (likely) a big assist from a reorganized Narcotics & Organized Crime division. The 2017-18 budget approved more than $21 million for the Drugs & Vice Division, the Family Services Division, the Gang Enforcement Team, and the Gun Task Force together. The 2021-22 adopted budget approved $24.6 million for the Enhanced Community Safety Team (ECST), Focused Intervention Team (FIT), and Narcotics & Organized Crime together. Names and programs have reshuffled (slightly), but not a lot else seems to have changed.
What has changed is patrol. If the goal of “defunding” was to fund fewer officers out and about stopping and frisking, the news is not great. The FY 2017-18 budget set out about $69 million for patrol, emergency management services, and specialized tactical units as a whole bundle (including Portland’s version of SWAT, the Special Emergency Response Team, or SERT). The 2021-22 adopted numbers are not just larger, they are more focused—about $106 million for Precinct Patrol alone, an increase of 53%. Whatever this means bureaucratically, it is absolutely orthogonal from any notion of “defund”.
Conclusion
The basic conclusion is unmistakable: the City Council remains as committed as ever to funding its armed enforcers. Moreover, if anyone had just this minute heard that the City of Portland had “defunded the police” in one of the past 17 years, and were handed this data, they would likely need several tries to pick the correct year. It’s just not a supportable conclusion by the numbers, the history, or in reference to percentages of budgets at various levels.
In a normative world of political compromise, the general rule is to begin negotiations from an elevated stance in order to compromise on the number you actually wanted all along. I don’t presume to fully understand their strategy but PAALF and Unite Oregon mounted a political campaign on the back of the street-led movement for less than a quarter of what full “defunding” would be and got nothing, although I know they legitimately tried their best to out-politick business as usual. So much for protest and its direct influence of the political process (and the suggestion that “We just gotta vote harder”). PPS alone, perhaps, made a sound, defensible, and reasonable educational decision.
On the other hand, there is evidence that the protests drove down the desire of individuals to police. (I still want to know what the increased PPB budget from 2010-2018 was doing with such a reduced staff.) This is not inconsequential if the desire is the abolition of police—ultimately reducing the number of people willing to be police officers may prove to be everything. What was inconsequential was asking the system to divest itself from the organ it uses to enforce its own interests. If there’s a lesson to be drawn here, I think it is this: Direct action gets the goods (as it always has).
Endnotes
1 Guy: “Police have been defunded!” Me: “No, they really haven’t.” Guy: “Oh no, they definitely have. It’s complete anarchy!” Me: Sigh. “I literally do this for a living and don’t want to talk about it while I unwind, but that’s not true and I wish I had the spreadsheets here to show you. In sum, a lot of cops quit. Have a nice evening.” Guy: “But, but DEFUND—anarchists—outside agitators!…”
2 The direct link to the demands has expired; what I can find now revises that early $50 million to $35 million, or ~15%. More discussion on this notion, even from community policing supporters, can be found here.
3 First, “revised” budgets represent a revision performed early in the fiscal year once revenue starts to flow. Second, I could not find all of the actual expenditures comparably reported in the online documents and the formatting changed confusingly several times over 17 years.
4 The differences between reality and the reported cuts—i.e., between +$1.7 million and -$75 million—may reflect federal spending. I simply don’t know. I have also found no discussion either in the media or budget documents that current service levels—meaning the body of work routinely undertaken by PPB—were affected.
5 All figures aren’t available for all years, so I presented mostly adopted budgets with revised numbers substituted for 2005-06.
6 See here for discussion for other large cities—41% is extremely high and even one-third is a lot.
7 If you remove Disability/Retirement from the analysis completely, it turns out that Fire & Rescue is the big Public Safety winner, increasing their budget by $28.5 million and 2.6%. Really makes you think about what we could do with less police funding, doesn’t it?
8 Authorized staffing positions are not always represented in whole numbers, so I’ve rounded.
9 Data on that list is still available here.
10 PPS’s budget for those relevant years showed no direct reference to SROs, so this money was likely allocated directly through PPB.
11 My thoughts on “community policing” are accessible here, here, here, and many other places.